Making the Invisible Visible: Mapping Informal Cities
The Blind Spots in Urban Planning
From the labyrinthine pathways of Vidigal in Rio de Janeiro to the sprawling urban landscapes of Orangi Town in Karachi, informal settlements are home to over 1 billion people worldwide. Vast, dynamic, and unplanned, these settlements remain largely invisible in mainstream culture.
Informal settlements — often called shanty towns, slums, or favelas — emerge when people build their own communities outside formal systems, either because they can’t afford to live within them or lack the legal right to do so.
For all their scale and significance, though, these communities remain largely unmapped, unrecognized, and misunderstood. Understanding how they work requires precise, granular data. And that understanding starts with mapping.
The only problem? Traditional mapping approaches, designed for orderly street grids and regulated construction, fail in these environments.
What’s needed is a new generation of tools that can capture the complexity of informal settlements and translate it into actionable insights. Using advanced technologies like Light Detection and Ranging (LiDAR) combined with immersive storytelling, Journey, in collaboration with our partners at MIT’s Senseable City Lab, are working to help solve this challenge by making the invisible visible.
The Cost of Invisibility
In informal settlements, mapping can be a matter of life and death. It allows residents to understand where landslides or floods threaten to sweep away neighborhoods, where unstable construction could trigger collapses, where airflow is stagnant, and much more. Without mapping, it’s impossible to know where to add sewage systems, how to improve unsanitary conditions, or even where to establish WiFi networks to reach the people who need them most.
The residents of informal settlements have already built their own ad hoc systems for water, electricity, and mail delivery. But without detailed mapping, official services remain locked out, unable to complement the grassroots solutions with new infrastructure.
Consider Vidigal, a mountainside favela in Rio de Janeiro that sits ten minutes from Ipanema Beach. Here, steep pathways thread between buildings that lean on each other for structural support. Homes expand upward as families grow. Infrastructure follows the logic of necessity rather than regulation.
Conventional mapping techniques may work fine for parts of Rio with neat grids, clear property lines, and buildings that adhere to zoning. Drone footage captures clean floor plans, laser measurements deliver precise distances, and engineers translate it all back into orderly blueprints.
But try to map Vidigal with these same tools and approaches, and you’ll miss a lot. Here, the line between road and passageway is negotiable. That gap between buildings might be a public plaza, a future construction site, or breathing room that the community has decided to preserve. Buildings grow organically in response to family needs and available space.
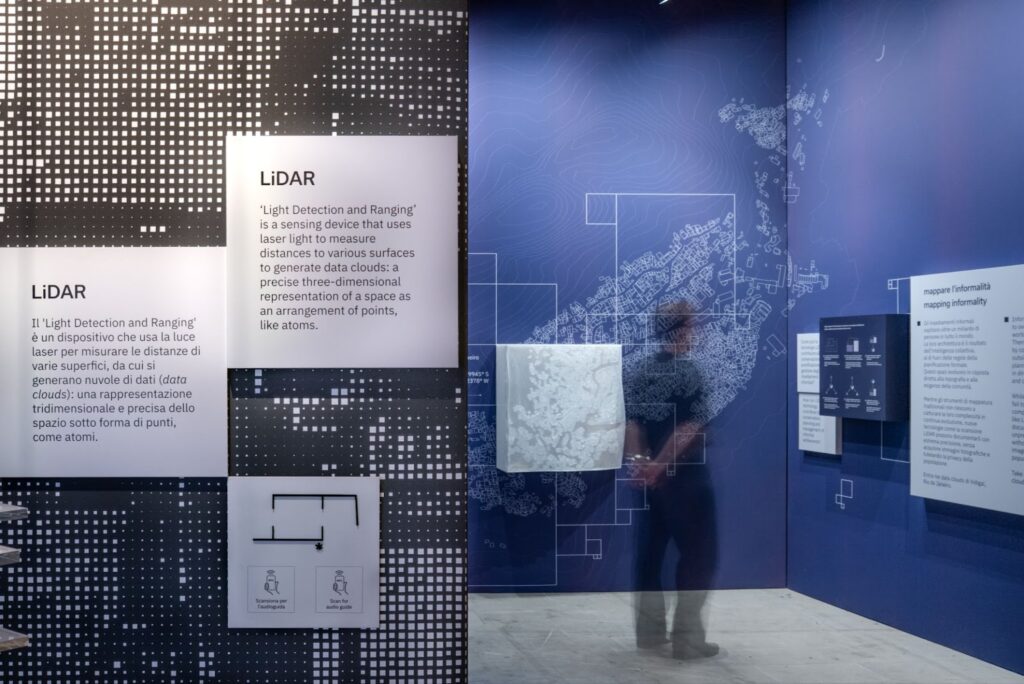
Instead of using conventional urban mapping for informal settlements like Vidigal, we need tools like LiDAR (Light Detection and Ranging) that capture what makes these places work: their adaptive, human-centered intelligence.
LiDAR as a Storytelling Device
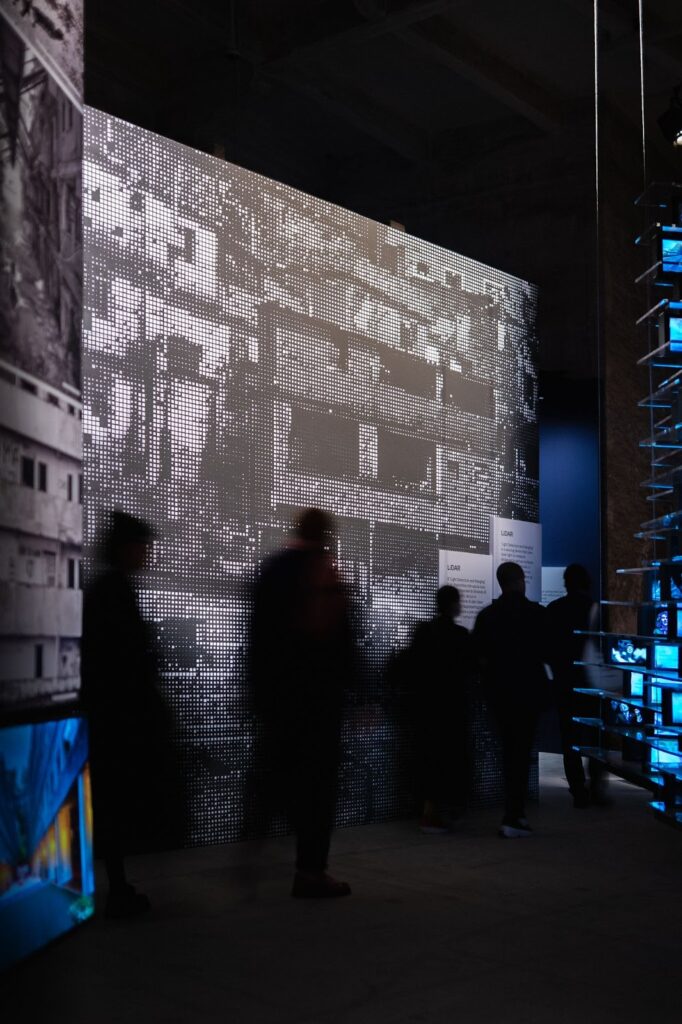
LiDAR works by emitting rapid pulses of laser light and measuring how long it takes for each pulse to bounce back from physical surfaces. It creates detailed 3D point clouds that can penetrate beyond the visible surface and capture the intricate architectural layers of informal streetscapes.
In action, LiDAR looks deceptively simple: researchers wear a backpack equipped with the laser scanning technology and walk the streets, gathering millions of data points as they move through narrow pathways and between buildings. With that data, we can generate highly detailed models of the settlement.
From there, policy makers can begin implementing solutions for more inclusive, sustainable cities. They can identify where poor airflow creates health hazards, where congestion chokes movement, and where unstable terrain threatens collapse. Since LiDAR can map individual structural elements down to their load-bearing relationships, the precision is remarkable.
This LiDAR mapping is a crucial first step in helping inhabitants establish legal property rights to the homes they’ve built. At the moment, ownership in Vidial remains ambiguous because all construction there is technically illegal. But detailed 3D models can identify property parcels with surgical precision, opening the door to a future where blockchain technology could allow inhabitants to formally stake claims to their homes.
One group pioneering this approach is the MIT Senseable City Lab, a multidisciplinary research group that brings together researchers from many academic disciplines to study the interface between cities, people, and technologies. Knowing that better mapping leads to more informed interventions, the MIT group worked with the Rio de Janeiro government to map Vidigal closely.


part of the Data Clouds exhibition at La Biennale di Venezia.
Better mapping is just the beginning, though. The raw data of LiDAR tells us where things are, but not what they mean. To take it to the next level, designers are using immersive storytelling tools to help contextualize LiDAR’s millions of coordinate points floating in digital space. It’s a way of transforming abstract measurements into a narrative that captures not just the physical dimensions of a settlement, but its social architecture as well.
From Vidigal to Venice
For Journey, technology isn’t just a tool for analysis; it’s a medium for empathetic storytelling and a way to explore new possibilities for the spaces that make up the fabric of our communities. With this in mind, we collaborated with the MIT Senseable City Lab to create an immersive exhibition for the Biennale Architettura 2025 in Venice. We wanted to transform their research into something that visitors would experience fully — not just abstractly read about.


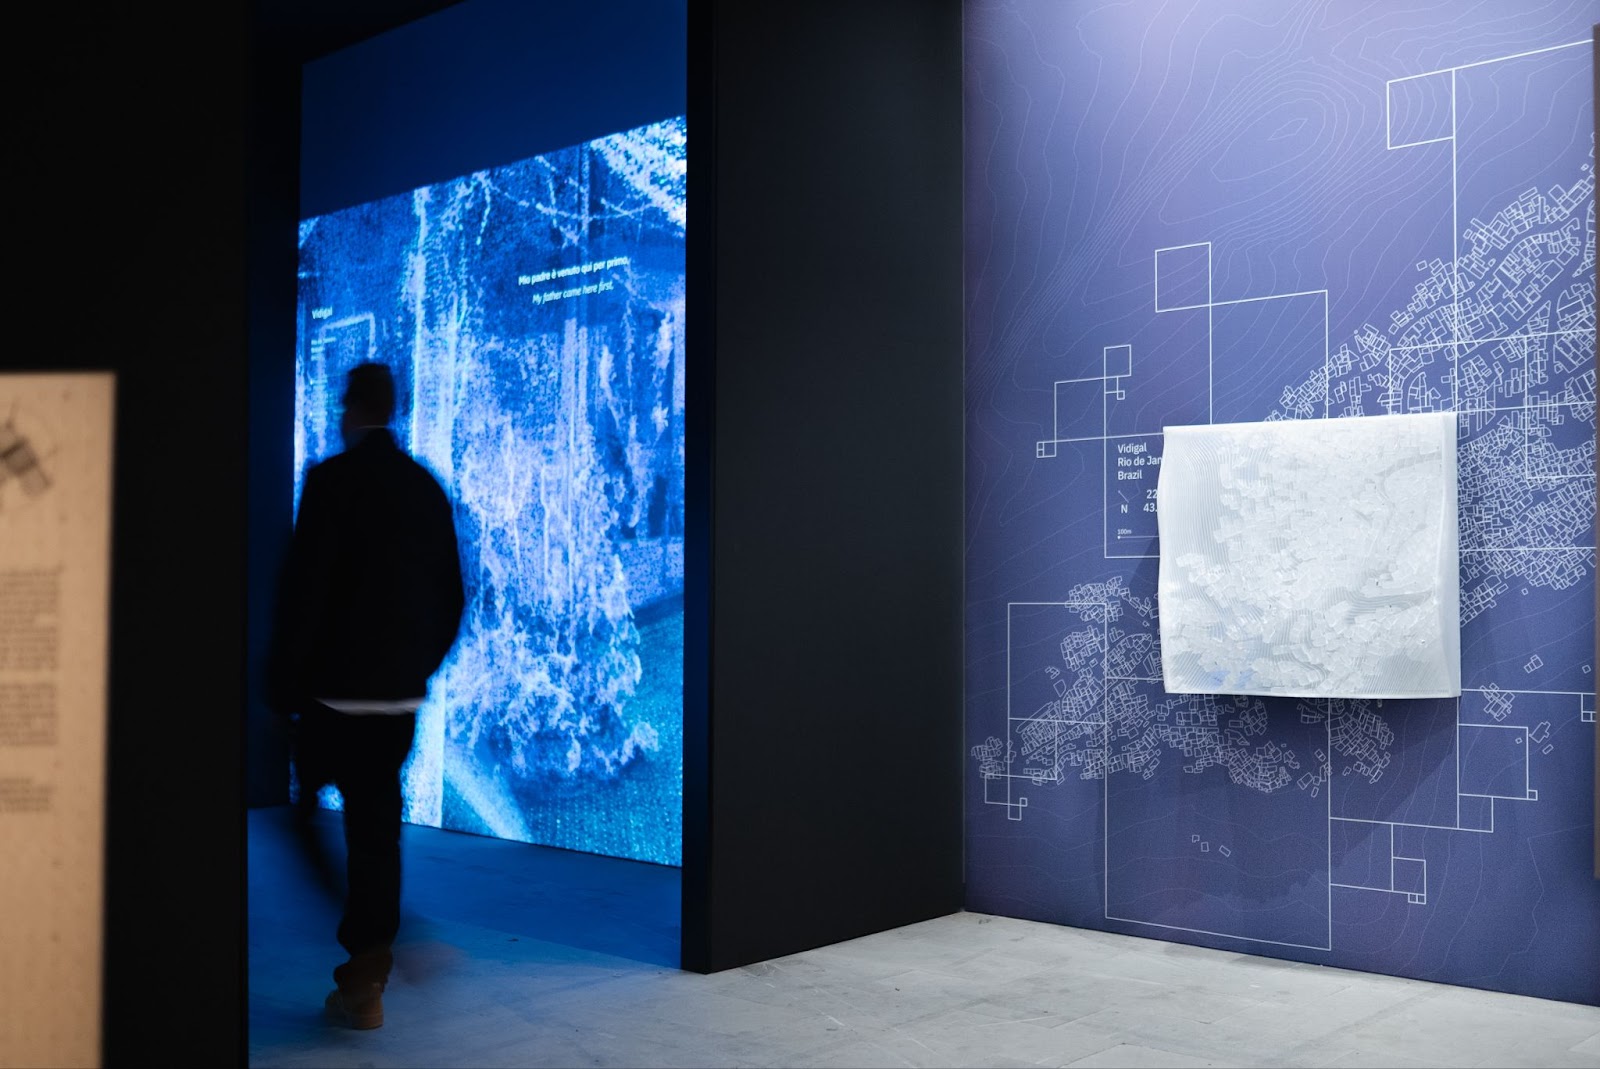
To create a captivating story out of the impersonal LiDAR data, we built a physical replica of Vidigal’s narrow streets within the exhibition space and projected animations of the LiDAR scans onto the walls, enabling visitors to ‘walk’ through the settlement virtually.


The exhibition unfolds across several distinct experiences. First, visitors encounter an introductory room with informational signage that explains the challenges of mapping informal settlements, alongside a 3D printed model of Vidigal. From there, they enter the main film room that recreates the experience of walking through Vidigal’s streets, allowing them to switch seamlessly between experiencing the human story and learning about the technical innovation.


To help build the human narrative around Vidigal, we added audio storytelling from interviews conducted with residents. The recordings centered on three key themes: the community’s complex relationship with the inherent beauty and danger of their natural surroundings, the entrepreneurship and growth happening within the settlement, and residents’ deep connection to property ownership and place.
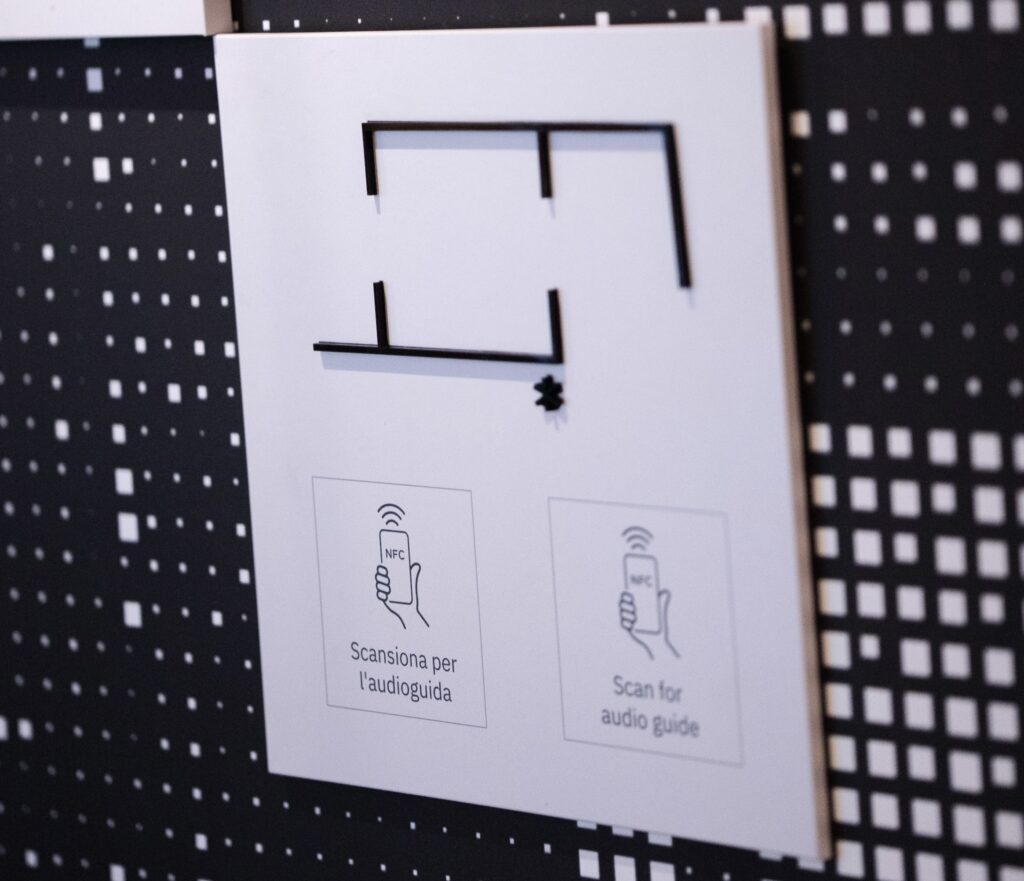
Accessibility was a key goal for the exhibition, as it is for all our design work. We used straightforward language to explain the technical complexity of LiDAR research, ensuring the message would be easily absorbed by everyone. We also layered all our visual and audio materials so that people with sensory limitations could still experience the story. We also added an audio guide and multilingual subtitles.
The result is an experience that highlights the resilience of misunderstood and marginalized communities without romanticizing their situation. Our goal was to avoid cliches and see the community through the neutral eyes of researchers, without losing sight of the human experience at its heart.
Telling the Story of Resilience by Design
Urban mapping and storytelling with data are both part of a broader shift in architecture and urbanism: a move from top-down design toward participatory, narrative-driven approaches. It’s a shift that we hope will facilitate important conversations about the right to the city — and even how the future of urban resilience might already be alive and growing in places we’ve overlooked.
This shift isn’t just more engaging for visitors; it’s also vital for understanding complex urban spaces. It’s what turns impersonal data into the kind of story that helps government leaders understand the impact of their policy decisions.
Ultimately, storytelling allows us to highlight the adaptive intelligence of self-organized communities and amplify voices that would otherwise go unheard. These settlements display remarkable resilience and innovation, from their informal markets to their intricate social systems for sharing resources. Better mapping and better storytelling helps inhabitants make the best possible decisions about their own neighborhoods.
The billion people living in informal settlements aren’t waiting for anyone’s permission to build their cities. They’re doing it right now, with remarkable creativity and determination. If we can evolve how we understand, map, and tell stories about these urban spaces, we can hopefully encourage even stronger, more resilient communities for the future.